
The Gas Laws
The Gas Laws: Overview
This Topic covers sub-topics such as Charles' Law, Gay-Lussac's Law, Ideal Gas, Absolute Zero Temperature, Gas Laws, Combined Gas law, Isobar in Graph, Isochore in Graph, Graphs Based on Charles' Law, Graphs Based on Boyle's Law and, Isotherm in Graph
Important Questions on The Gas Laws
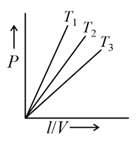
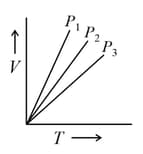
The below graph represents Gay-Lussac’s law.

Explain graphical representation of Gay-Lussac’s law.
The graph between P and T according to Gay lussac's law is a
A gas is heated from to at pressure. If the initial volume of the gas is , its final volume would be
Air expands on heating and hence its density _____. (increases/ decreases)
For a fixed amount of gas at constant temperature, volume of a gas is _____ proportional to the pressure of a gas.
The slope for an isochore plotted for a van der Waal's gas neglecting molecular attractions is equal to:
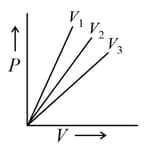
What type of graph is obtain when pressure is plotted against volume?
A combustible gas is stored in a metal tank at a pressure of at . The tank can withstand a maximum pressure of after which it will explode. The building in which the tank has been stored catches fire. Now predict whether the tank will blow up first or start melting(Melting point of the metal ).
The plot of volume versus pressure at constant temperature is _____. (hyperbola/parabola)
Slope of the plot between and at constant temperature is
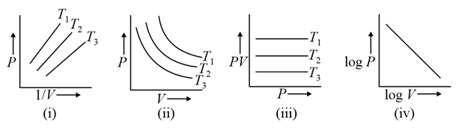
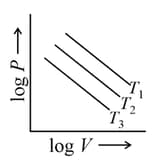
Graphs between pressure and volume are plotted at different temperatures. Which of the following isotherms represents Boyle's law as PV = constant?
A flask of capacity is heated from to . What volume of air will escape from the flask?
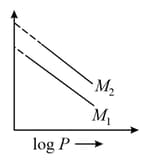
For same mass of two different ideal gases of molecular weights and , Plots of at a given constant temperature are shown. Identify the correct option.
For of an ideal gas, in fig.1, in fig. , in fig. , and in fig. , then which curves are correct.
3.
Read the following statement and explanation and answer as per the options given below:
Assertion: The pressure of a fixed amount of an ideal gas is proportional to its temperature
Reason: Frequency of collisions and their impact both increase in proportion to the square root of temperature


